The places where the birthing people you serve live, work, and play matter for their health. How are you creating livable communities and helping birthing people thrive in them?
What local dashboard users are saying:
“When you feel that you’re not alone, it feels much better, it gives you motivation, and when you see the information of the website, the dashboard that has a lot to be done, you want to be part of this change.”
– Direct Service Provider
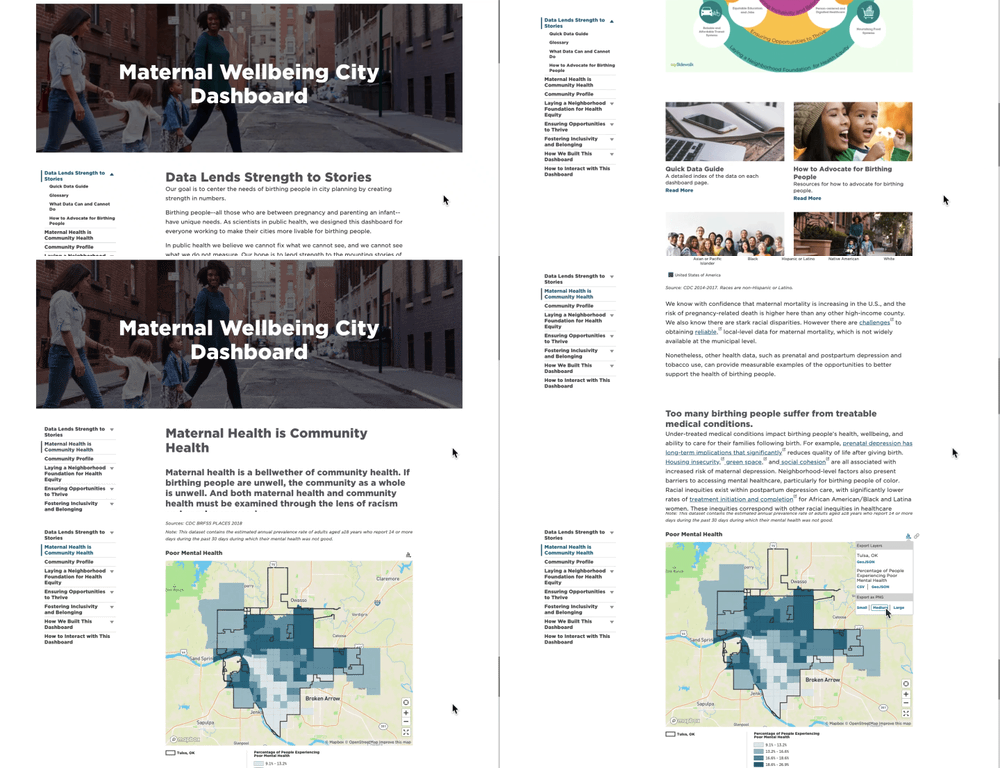
The Maternal Wellbeing City Dashboard provides data and narratives to help you identify which maternal health priorities may have the greatest impact to improve birth equity in your city. These data can also help you obtain accountability for results, and track progress toward achieving equitable wellbeing for all.
The use cases below provide examples for how you could use the dashboard from your position as a Direct Service Provider or Nonprofit. One of the most important values of the dashboard is as a tool to engage other local stakeholders about maternal health — check out how others could use the dashboard as Policy Advocates, Local Legislators & Staff, or Civil Servants.
Explore the Dashboards
“I think it will increase my confidence … having good reliable data points is always so important.”
– Direct Service Provider

Use local data to educate communities, volunteers, and other providers on community needs to support birthing people
Download data visualizations to incorporate into posters, slides, or curriculum

- Review the left hand tab menu or the promo cards at the bottom of the landing page to identify the issue areas or domains that can best support the learning goals for your curriculum
- Explore the most relevant domain pages for data and narratives that help your learners understand the impact of that domain on birthing people in your community
- Navigate to your domain(s) of interest and copy or download narrative, data points, visualizations, or references to include in your curriculum

Share knowledge and resources to start or expand collaborations to support birthing people
Share dashboard pages to start conversations about our shared responsibility for supporting community wellbeing for birthing people

- Review the graphic on the landing page to understand the different neighborhood and community factors affecting maternal health
- Use the left hand tab menu or promo cards to explore the issue area or domain pages for factors that can help start conversations with your collaborators on the impact of that domain on birthing people in your community
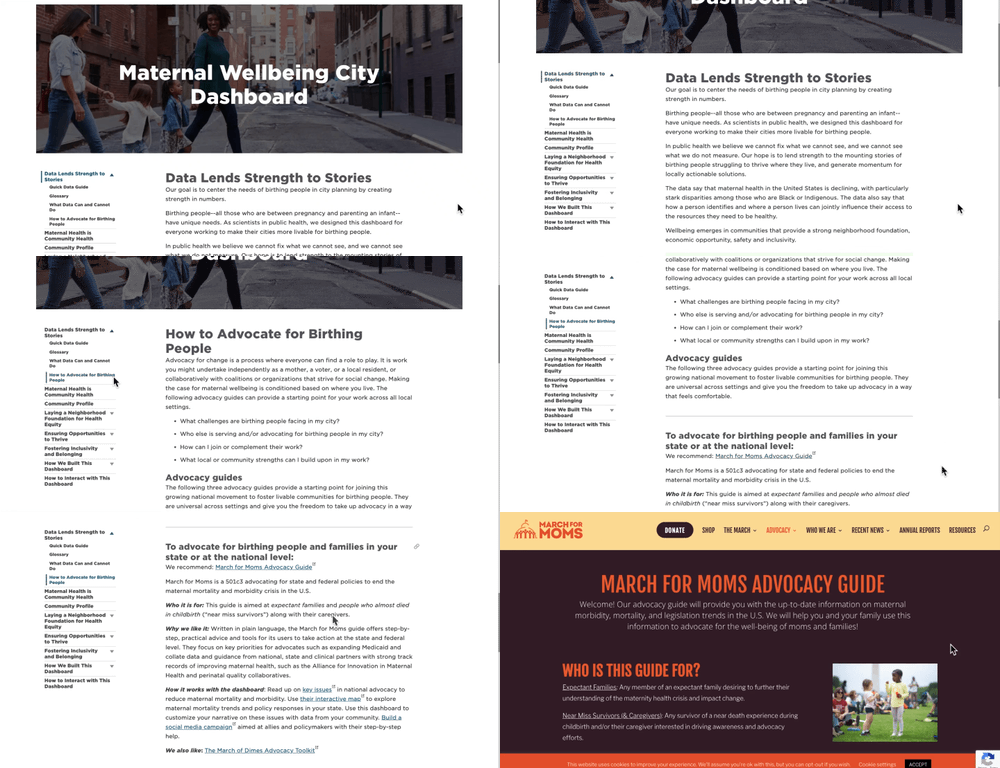
- Review the “How to Advocate for Birthing People” page on the left hand tab menu (under the “Data Lends Strength to Stories” dropdown) for resources to support you and your collaborators with taking action

Use data to plan strategy or fundraising for programs that support birthing people
Identify data to support existing programs or to target new programs where they are most needed

- Review the left hand tab menu or the promo cards at the bottom of the landing page to identify the issue areas or domains that align with your program goals
- Use the left hand tab menu or promo cards to explore the issue area or domain pages for the most compelling data to guide the direction of or make the case for your program
- Navigate to your domain(s) of interest and copy or download narrative, data points, visualizations, or references to incorporate into your strategic plans or grant proposals
Learn More
Read our white paper to learn more about the design and testing of the Maternal Wellbeing City Dashboard.
Read a case study on Tulsa or Pittsburgh.
Contact Us
Reach out to our team at deliverydecisions@ariadnelabs.org.


